Projects
Here is a nice project:
You can also still use R!
library(tidyverse)

plot_df =
  tibble(
    x = runif(100),
    y = 1 + 2 * x + rnorm(100)
  )

plot_df |>
  ggplot(aes(x = x, y = y)) +
  geom_point()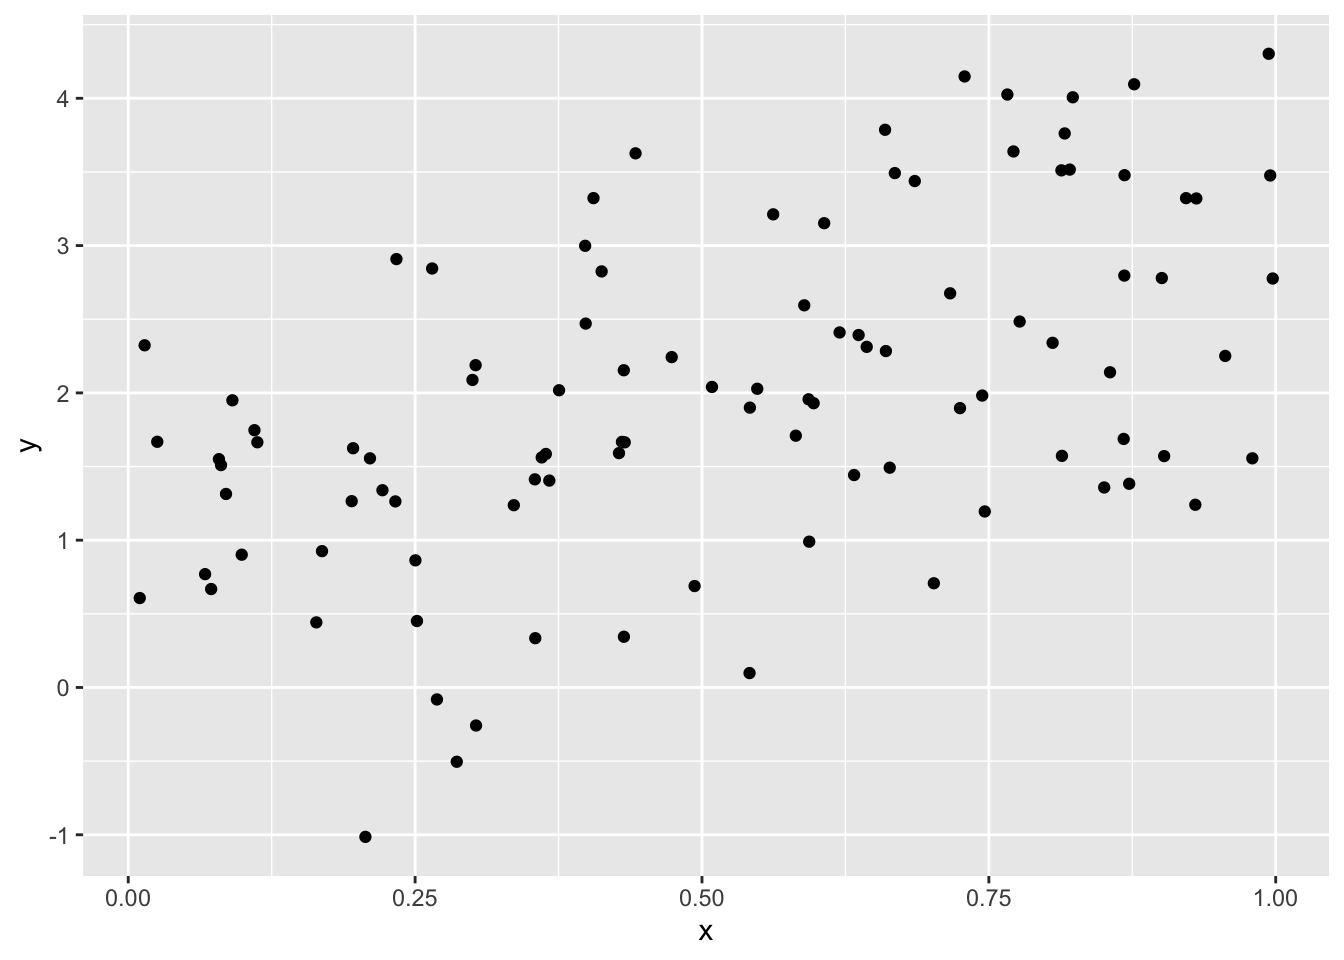
You can also still use R!
library(tidyverse)
plot_df =
tibble(
x = runif(100),
y = 1 + 2 * x + rnorm(100)
)
plot_df |>
ggplot(aes(x = x, y = y)) +
geom_point()